For documentation on the current version, please check Knowledge Base.
Scale Limits
What are Scale Limits?
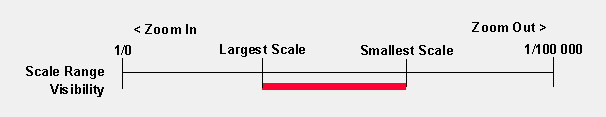
Scale Limits ensure that the graphical component is visible when the view on the MapCanvas is between a specified scale range. Outsite the scale range the graphical component remains invisible.
| Scale Range Limits | |
|---|---|
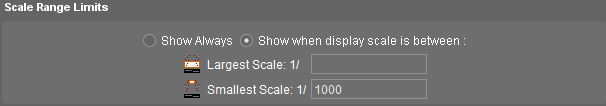
| Choose to apply scale limits or not | |
| Largest Scale | The geographical component is invisible when zoomed IN more than the specified largest scale. |
| Smallest Scale | The geographical component is invisible when zoomed OUT more than the specified smallest scale. |
Why using Scale Limits?
| The readability of the mapview | Legend objects such as labels, pie charts or symbols that are used to represent the dataset, can overlap each other when the view is zoomed out to a smaller scale. Especially when 'point on screen' for size unit is chosen. |
|
|---|---|---|
No Scale Limits 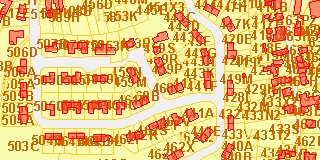  | Scale Limits for Labels 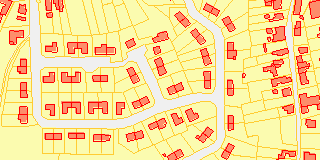 |
|
| Loading the dataset on a small scale | For datasets with a high accuracy on a large scale or for large file datasets , it can take a while to load the dataset on a small scale. When navigation functions such as zoom in, zoom out or pan are used, each time the view on the mapcanvas must be redrawn (reloaded). |
|
Example 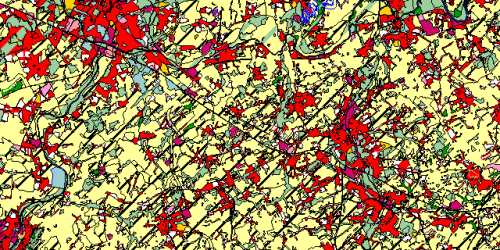 |
||
| Scale dependent layers | Sometimes different layers are used to represent one entity. Depending on the scale of the view, another layer is displayed. Each Scale-level has it's own appropriate layer that is adapted to the scale. This way the loading time of the whole entity is reduced. This technique can be used in dataformats such as OCR, that combines many datasets, or in datasets with more models such as ovf, or between datasets of a workspace. |
|
Example: as zoomed in more, more details appear because other layers become visible due to scale limits. 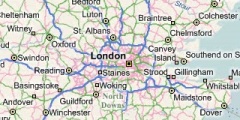 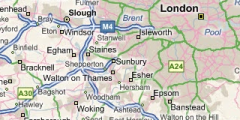 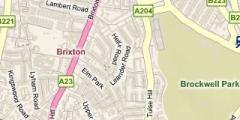 |
||
How to set Scale Limits?
Dataset Scale Limits
The Scale Ranges are applied for the dataset itself.
When the dataset is invisible due to dataset scale limits its name appers italic in the dataset list.

In this example, the dataset “city” is not displayed at the current scale: it is invisible because of Scale Limits imposed on the dataset, regardless the fact that the visibility setting is On.
Define the Dataset Scale Limits in:
- (1) General Settings: enter the scale ranges manually
- (2) Dataset Context menu: use the current scale
Scale Ranges defined by the Legend
Within a dataset you can specify Scale Ranges for each Model.
For each model you can specify the Scale Ranges for spatial object and for labels & layout objects.
When the objects are invisible, the name of the dataset displayed in the Datasets & Dataset Lists does NOT appear in italics.
Define scale ranges for models in the General Settings of the Legend:
- (3) Scale Ranges for Spatial Objects:
Spatial Objects, such as points, lines or areas, are the objects of the dataset as presented on the mapcanvas
- (4) Scale Ranges for Labels & Layout Objects:
Labels and Layout Objects, such as Pie Charts, are specified in the legend and are related to the attribute values of the objects.