This is documentation of an archived release.
For documentation on the current version, please check Knowledge Base.
For documentation on the current version, please check Knowledge Base.
Back to Dataset Legend Editor
Pie Charts
A PieChart is a graphical presentation of one ore more Attribute Values.
It is a circular chart divided into sectors, illustrating the the attribute values.
Labels and PieCharts are the Legend Layout Component
It is a circular chart divided into sectors, illustrating the the attribute values.
Labels and PieCharts are the Legend Layout Component
![]()
Right-Click on the dataset in the Dataset List: Context Menu > Dataset Properties > Legend and Labeling > Pie Chart
- Pie Chart Appearance: Add pie chart title, labels, shadow, …
Steps to Create Piecharts
- Turn on Piecharts : tick “Show the pie charts”
- Select Piechart definition : By Attribute or By Classification
- If By Attribute
- Attribute: Select an attribute for the slice using the drop-down box. Invalid attributes of data type string or boolean aren't selectable
- Color: Choose a fill color from the color picker window for the slice or use Auto Color
- Label: Enter a label name for the slice or use auto label
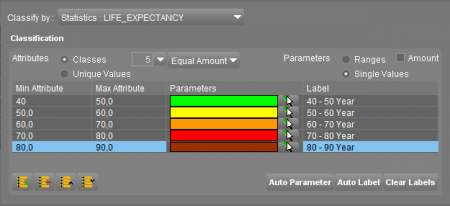
- If By Classification
- Classify by: Select an attribute which values will be represented in a pie chart
- Classification box: See classification in classes
Types of Pie Charts

| By Attribute | By Classification |
|---|---|
| In Orbit GIS, an object can hold several records or attributes per Attributeset. Each slice of the pie chart is defined by the (first) value of an attribute. Use this charting technique to graphically represent the value attribute according to the other chosen attribute values per object. | In Orbit GIS, an object can hold several records or attributes per Attributeset. Each record of an attribute set of an object can have one or more values. This means that one attribute record can have several values. Use this charting technique to graphically represent the different values of one attribute per object. Note: this option is not available for attributes of a shapefile, because shapefiles cannot contain more than one value. (Except when an external table with more values is linked to a shapefile, more information see Table Join) |
| Object Inspector | |
 |  |
| Slice Definition | |
 |  |
Manage slices
Order and Amount

- Create a slice
- Delete a slice
- Move the selected slice one up in the legend display
- Move the selected slice one down in the legend display
Color
- Choose a color:
- Auto Parameter: In stead of manually modifying the color for each slice, use the Auto Parameter button to automatically generate a color.
- Auto Color:
Label
For display purposes, assign a label to each slice. Legend Displays are used in the Legend Display.
Type in a label for each slice by clicking on the label field at the right side of each row. Use the Auto Label button to create labels based on the attribute values. Use the Clear Labels button to clear all label fields.
Last modified:: 2019/03/25 11:36