Preferences MapCanvas
This page shows the setup of the preferences regarding to the MapCanvas.
| Isolation Mode | |
|---|---|
| If the Isolation Mode is enabled for one or more datasets, all other dataset ( isolation mode disabled ) will be shown according to the settings below: | |
| Greyscale | All other datasets are shown in greyscale. |
| Transparency | All other datasets are shown transparent. |
| Wireframe | For all other datasets only the outline is shown ( in case of vector data ). This function has no effect on image or raster data. |
| Dim Mode | |
| If the Dim indicator is enabled for one or more datasets, these datasets will be displayed on the map according to the settings below: | |
| Greyscale | When the Dim mode is enabled, the dataset(s) will be shown in greyscale on the map. |
| Transparency | When the Dim mode is enabled, the dataset(s) will be shown transparent on the map. |
| Greyscale and Transparency | It is also possible to select Greyscale and Transparency at the same time. When the Dim mode is enabled, the dataset(s) will be show in greyscale and transparent on the map. |
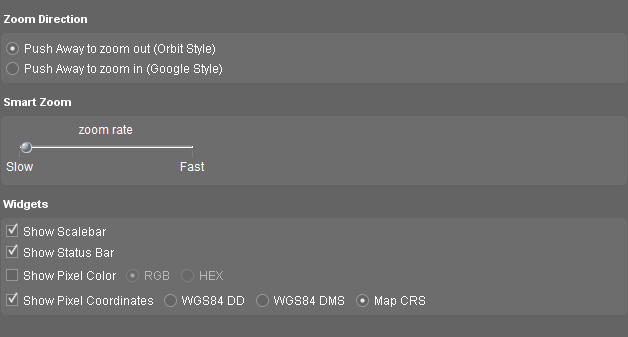
| Smart Zoom Direction | |
| It is possible to change the direction of the Smart zoom ( also the Mouse scroll ): | |
| Orbit Style | Push or scroll away to zoom out. |
| Google Style | Push or scroll away to zoom in. |
| Smart Zoom Modifier | |
| To adjust the smart zoom rate and the smart zoom factor: | |
| Set smart zoom rate | Increase the zooming speed by setting the zoom rate faster. The smart zoom will zoom in and out slower or faster according to the adjustments. |
| Widgets | |
| under construction | |