This is documentation of an archived release.
For documentation on the current version, please check Knowledge Base.
For documentation on the current version, please check Knowledge Base.
Preferences MapCanvas
This page shows the setup of the preferences regarding to the MapCanvas.
| Isolation Mode | |
|---|---|
| If the Isolation Mode is enabled for one or more datasets, all other dataset ( isolation mode disabled ) will be shown according to the settings below: | |
| Greyscale | All other datasets are shown in greyscale. |
| Transparency | All other datasets are shown transparent. |
| Wireframe | For all other datasets only the outline is shown ( in case of vector data ). This function has no effect on image or raster data. |
| Dim Mode | |
| If the Dim indicator is enabled for one or more datasets, these datasets will be displayed on the map according to the settings below: | |
| Greyscale | When the Dim mode is enabled, the dataset(s) will be shown in greyscale on the map. |
| Transparency | When the Dim mode is enabled, the dataset(s) will be shown transparent on the map. |
| Greyscale and Transparency | It is also possible to select Greyscale and Transparency at the same time. When the Dim mode is enabled, the dataset(s) will be show in greyscale and transparent on the map. |
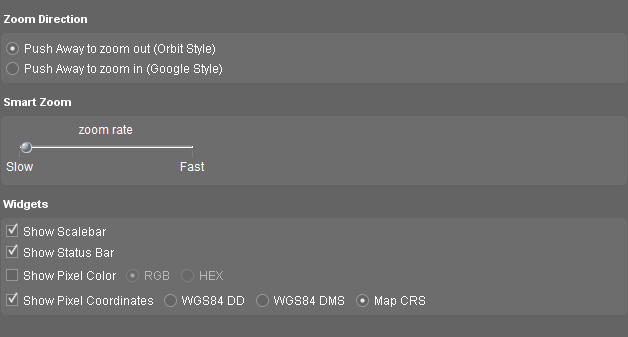
| Smart Zoom Direction | |
| It is possible to change the direction of the Smart zoom ( also the Mouse scroll ): | |
| Orbit Style | Push or scroll away to zoom out. |
| Google Style | Push or scroll away to zoom in. |
| Smart Zoom Modifier | |
| To adjust the smart zoom rate and the smart zoom factor: | |
| Set smart zoom rate | Increase the zooming speed by setting the zoom rate faster. The smart zoom will zoom in and out slower or faster according to the adjustments. |
| Widgets | |
| under construction | |
Last modified:: 2019/03/25 11:36