For documentation on the current version, please check Knowledge Base.
General Settings
Give a description to the legendfile, adjust the sequence of the models within the dataset or apply Scale Ranges.
![]()
Right-Click on the dataset in the Dataset List: Context Menu > Dataset Properties > Legend and Labeling > General Settings
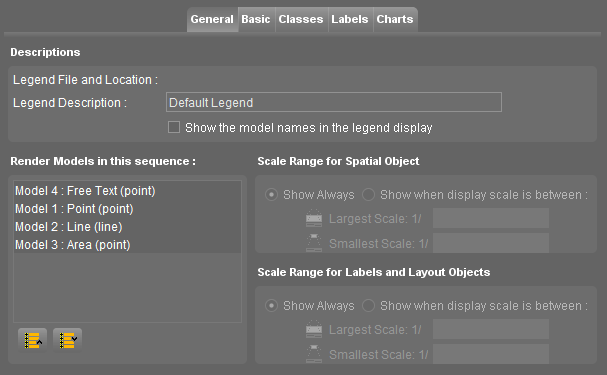
Legend Description

| Description | |
|---|---|
| Legend File and Location | Displays location and name of the legend file. If this field is empty, the current legend has never been saved. |
| Legend Description | Type in an optional legend description to distinguish different legends for the same dataset. If there is only one legend for a dataset, it is probable to leave this field open. The legend description will appear in the Legend Display. |
| Show the model names | Thick this option to see the model names in the Legend Display. |
The Appearance of Models
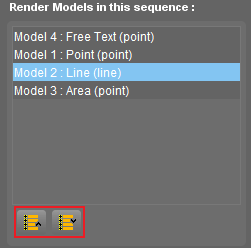
Within a dataset it is possible to define the sequence in which the models must be drawn one on top of the other. The sequence can be set here, as a specification within the legend.
- Of course, this is only useful for datasets with more than one model.
- The models at the top are displayed above the models at the bottom.
Tip: respect the following sequence for modeltypes (from top to bottom): point - line - area - raster/image. - Click on a model in the list and use the move up or down button to adjust the sequence of the models in the list.
The same issue occurs with the sequence of the datasets in the dataset list, see Dataset Sequence
Scale Ranges for Models
Scale Limits ensure that the graphical component is visible when the view of the MapCanvas is between a specified scale range. Outside the scale range the graphical component remains invisible. More information about Scale Limits see Scale Limits.
Specify Scale Ranges within a dataset for each Model.
Apply Scale Ranges for spatial object and/or for labels & layout objects for the model.

First select the model, then apply scale ranges.
| Scale Ranges for Spatial Objects | Scale Ranges for Labels & Layout Objects |
|---|---|
| Spatial Objects, such as points, lines or areas, are the objects of the dataset as displayed on the MapCanvas. | Labels and Layout Objects, such as Pie Charts, are specified in the legend and are mostly related to the attribute values of the objects. |
 | 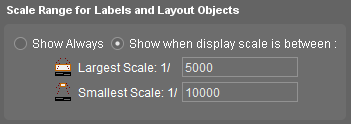 |
| Choose whether the spatial objects must be displayed always or to use Scale Ranges. Set the scale ranges if necessary. | |
Note: When the objects are invisible, the name of the dataset displayed in the Datasets & Dataset Lists does NOT appear in italics.