This is documentation of an archived release.
For documentation on the current version, please check Knowledge Base.
For documentation on the current version, please check Knowledge Base.
Back to Dataset Legend Editor
Pie Chart Appearance
Navigate to the main page for Pie Charts: Pie Charts General.
Slice Definition
See Slice Definition
Labels
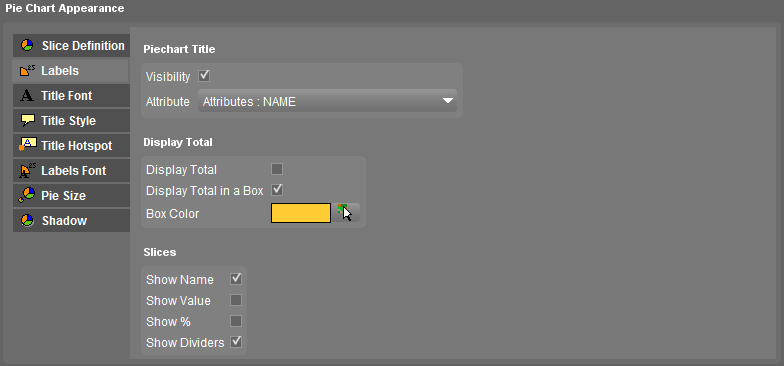
- Display an attribute value as pie chart title
- Place a total (or row count) in the centre of the pie chart, either boxed in a background color.
- Add labels to the slices
| Piechart Title | |
|---|---|
| Visibility | Tick to show a pie chart title |
| Attribute | Select the attribute which value will be used as pie chart title |
| Display Total | |
| Display Total | Tick to show the total value of the pie chart, the sum of the values of the different pie chart slices |
| Display Total in a Box | Tick to show the pie chart total in a box |
| Box Color | Choose a fill color using the color picker for the pie chart total box. This option is only useful when totals are displayed in a box. |
| Slice Labels | |
| Show Name | Tick to show the names of the pie chart slices |
| Show Value | Tick to show the values of the pie chart slices |
| Show % | Tick to show the percentage of the slices value to the total pie chart value |
| Show Dividers | Tick to show the dividers between the pie chart slices |
Display Total: For Pie Chart definition by attribute the sum of the attribute values will appear. For Pie Chart definition by classes the row count (amount of records) will appear.
Show Name: When attribute usernames are applied, see Dataset Structure - Naming, those usernames will appear as labels for pie charts when Show Name is applied.
Show Value: It is possible to give labels to attribute values, see Valuelist . When the Show Value is applied, the attribute value labels will appear.
Examples
Examples of using the Pie Chart label parameters see : Title / Labels


Title Font
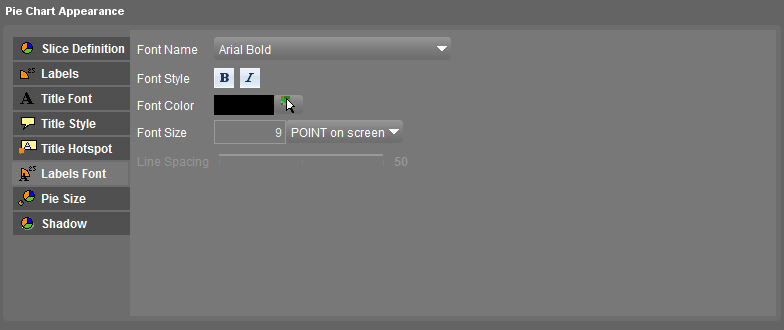
See Label Font.
Title Hotspot
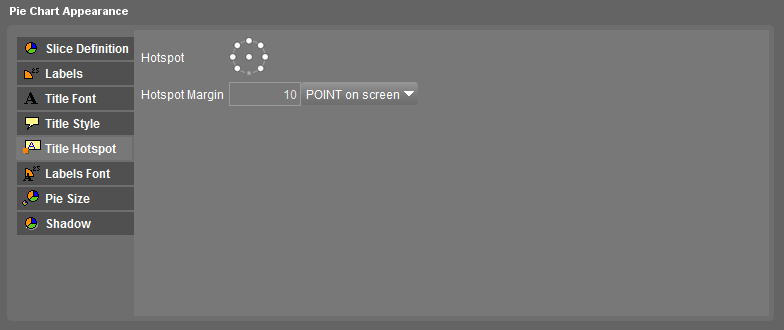
See Label Hotspot.
Labels Font
See Label Font.
Pie Size

| Field | Comment |
|---|---|
| Determine by | Select an attribute which value will determine the actual pie size. If no attribute was selected the radius minimum value will be the fixed pie chart size. |
| Radius minimum | Enter the minimum radius of the pie chart. |
| Radius maximum | Enter the maximum radius of the pie chart. The pie chart size will be interpolated between radius maximum en minimum according to the attribute value. |
| Size Unit | Select the size unit of entered radius. See size unit |
The size can be determined by an attribute value:
- choose the attribute that must determine the actual size,
- define a minimal and maximal size of the pie chart in pixels on screen,
- the pie chart size will be interpolated according to the attribute value.
Note: It is also possible to use meta-attributes such as row count (amount of records) for this attribute.
Shadow
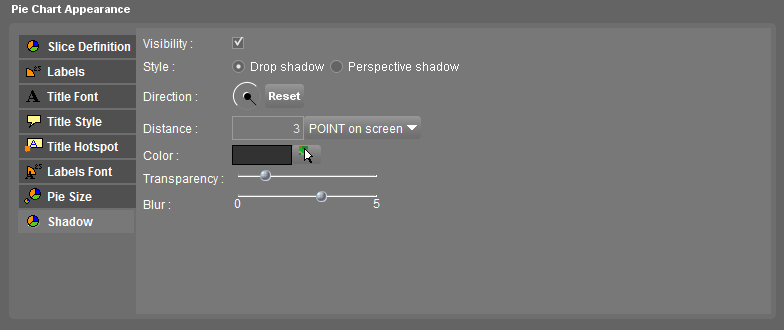
See shadow settings.
Last modified:: 2023/01/09 12:48