This is documentation of an archived release.
For documentation on the current version, please check Knowledge Base.
For documentation on the current version, please check Knowledge Base.
Back to Dataset Legend Editor
Examples of using Pie Charts
Title / Labels
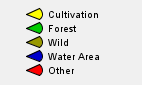
This legend is been used for the examples (slices defined by attribute):
- PieChart Title:
- Show Title = Visible
- TitleStyle = text
- TitleHotspot = 10 point on screen, above
- PieChart Labels: Show Name = Visible
- PieChart Shadow: Drop Shadow, 3 point on screen

- PieChart Title: Show Title = Visible, TitleStyle = text ; TitleHotspot: 10 point on screen, above
- PieChart Display Total: Show Total = Visible; Display in a box
- PieChart Labels: Show Value = Visible
- PieChart Shadow: Drop Shadow, 3 point on screen

- PieChart Title: Show Title = Visible, TitleStyle = text ; TitleHotspot: 10 point on screen, above
- PieChart Labels: Show % = Visible; Show Dividers = Visible
- PieChart Shadow: Drop Shadow, 3 point on screen
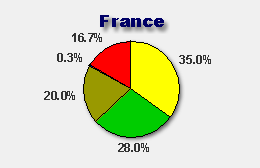
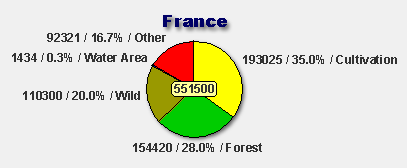
- PieChart Title: Show Title = Visible, TitleStyle = text ; TitleHotspot: 10 point on screen, above
- PieChart Display Total: Show Total = Visible; Display in a box
- PieChart Labels: Show Name = Visible; Show Value = Visible; Show % = Visible; Show Dividers = Visible
- PieChart Shadow: Drop Shadow, 3 point on screen
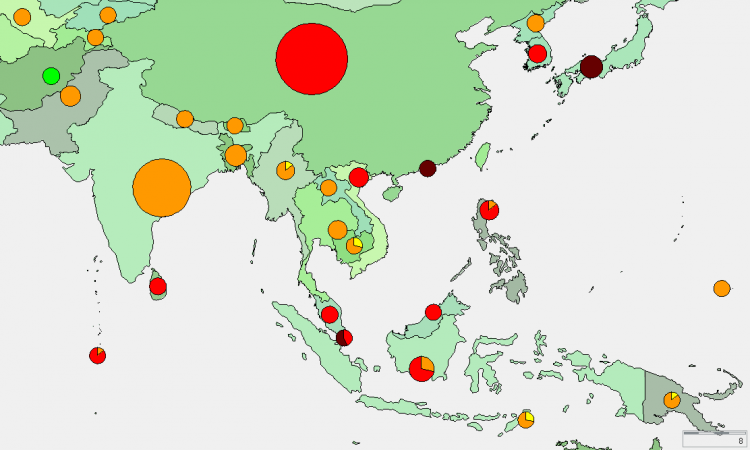
PieChart Size
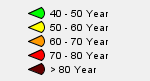
Legend (Expected Age at Birth, slices defined by classification):
Pie Size:
- Determine by: Population
- Radius minimum: 10
- Radius maximum: 40
- Size Unit: Point on Screen
Last modified:: 2023/05/12 16:31