For documentation on the current version, please check Knowledge Base.
Profiles and Cross Sections
This page describes how to use the extension “Profiles and Cross Sections”
![]() Main Toolbar > Extensions > Profiles & Cross Sections
Main Toolbar > Extensions > Profiles & Cross Sections
Concepts
The “Profiles and Cross Sections” extension automatically generates profiles and cross sections along a path on a point cloud dataset.
Profiles
A path represents a line through the point cloud between two or more points, which gives as result the 3D representation of the point cloud along that line.
A profile represents a straight line through the point cloud between two points, which gives as result the 3D representation of the point cloud along that line.
Cross Sections
A cross section represents a perpendicular line on a path, which gives as result the 3D representation of the point cloud along that section.
A path can have multiple cross sections.
Sidebar
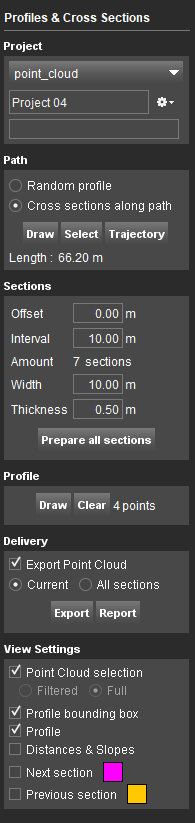
Source
Use the generic workflow for Point Cloud Based Extensions to define the source file.
The method for the range of interest is 'Path'.
Type of Section
Random profile
- The range of interest reference is automatically changed to 'Draw on Map'.
- Draw a new profile by clicking 2 positions (the beginning and the end of the path) on the Map Canvas. The third click is used to define the profile thickness. The profile will be calculated. It is advised to draw the profile on Map 3D, due to the impossibility of controlling the Z value if drawn on Map 2D.
Cross sections along path
- Draw: Draw a new path by clicking the defining two or more positions.It is advised to draw the path on Map 3D, due to the impossibility of controlling the Z value drawn on Map 2D.
- Select: Select a polyline object from the active dataset in the dataset list. The enitre selected opbject will be used to calculate the cross sections path.
- Trajectory: To use the trajectory, the vector file must be present in the dataset list.Only available for Mobile Mapping runs.
Sections
The sections along the path are drawn on Map 2D/3D and defined by the following parameters. After changing their value, hit enter to change the section representation on the map.
Offset
Distance from the beginning of the path where the first cross section will be created.
Interval
Distance between two consecutive cross sections.
Thickness
Thickness of every cross section. By increasing this value, more points will be used to create the profile.
Width
There are four methods to define the section width:
- Fixed: Enter one distance value that is used for all sections.
- Left/Right offset: Enter two distance values to have different left and right offsets starting from the path.
- By 2 Line Objects: Select 2 line objects and add them to define a varying section width.
- By 1 Area Object: Select 1 area object and add it to define a varying section width.
Amount
Based on the interval and offset the number of cross sections is automatically calculated.
Height
Height of the 3D bounding box that is used to select the points from the point cloud for creating profiles.
Classified point cloud
Include/Exclude classes to be used for the generation of the point cloud selection.
Prepare All Sections
For every section, a 3D bounding box is defined by the previous parameters to create an ops file per section.
Profiles
Point interval
2D Distance between two points on the profile. Decrease this value to get more detailed profiles.
Point radius
Distance around the profile point to get the point cloud points to be used.
Value of interest
The Z value that will be used to position the profile point: average, highest, lowest or median.
Fit lines
Remove points from the profile. Drawing a line from point A to C, B can be removed if it is closer to the line than the 'Dist pts to line max'.
Filter by time
Remove points from the ops file that have a timestamp difference higher than the 'Time gap' with the reference timestamp (defined by the timestamp with the largest amount of points).
Filter by height
Using steps with the distance of 'Point radius', check if there are clusters separated by a 'Z gap' vertical distance. If so, select the cluster based on the option selected: Bottom or Top.
PC Pixel Size
Reduce the density of the point cloud used by increasing this value. 0.0 is the most detailed level, all points of the point cloud will be used.
Update selection
Update the ops file for the section when re-creating the profile after applying the time and/or height filter.
Prepare all profiles
Automatically create the profile for all sections.
Draw
Manually draw/edit vertices on a random profile or on the opened section in the Profile Viewer.
Generate
Automatically re-create the profile of the opened section in the Profile Viewer.
Clear
Delete the created profile from the opened section in the Profile Viewer.
Slopes
Calculate Slopes: Recalculates the slopes per profile and between sections, and creates/updates the Slopes Profiles result file. Usefull when profiles are individually detected or manually adjusted via Profile Viewer. Profiles need to be created before this step. Slopes are automatically calculated with action 'Prepare All Profiles'.
Delivery
Following files are exported: path, sections and profiles as shapefiles, jpg snapshots for each section and coordinates txt files for each profile. Also pointcloud, if enabled, see below.
Export Pointcloud
Export the point cloud for the selected section or for all the sections, depending on the chosen option below.
The results will be stored in las and opc format.
Current
Only the opened section will be exported.
All Sections
All sections will be exported.One pointcloud will be exported for all sections, if the option is enabled.
Export
Press export to start.
Report
Created a pdf report regarding the profiles and cross-sections project.
View Settings
Allows the user to control the information that will be shown in the Profile Viewer Tab:
- Show/hide point cloud selection on the Profile Viewer
- Show/hide the profile bounding box on the map
- Show/hide the drawn profile
- Define the profile point sequence
- Left-Right: the order of the points is defined by their occurence from left to right
- Measured: the order of the points is defined by their time of measurement
- Show/hide distances and slopes on the Profile Viewer
- Display the next and previous sections in the Profile Viewer
Profile Viewer Tab
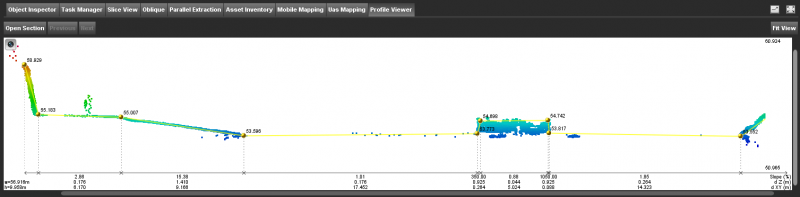
The Profile Viewer Tab opens the created cross section and displays the corresponding profile.
By default, when creating a random profile, it will be displayed in the Viewer.
Open section
Navigation between cross sections is done using Open Section tool and by using the Next and Previous.
Information about the length of the path, the height difference, minimum and maximum height are shown.
The information about the drawn profile is also listed.
Pay attention
If the random profile or the sections are not displayed in the Profile Viewer Tab (blank screen), it's due to the outdated pointcloud legend file in the template used to create the run.This issue can be solved by deleting “point_cloud.olg” file, from the run's pointcloud folder. Step two, by right-clicking the pointclod dataset in the dataset list, and choosing the Legend Editor, a new legend will be automatically created. Reopening the run will be display the profiles. This new legend file can be copied to all old runs in order to avoid the same issue.