For documentation on the current version, please check Knowledge Base.
Classification by Classes or Unique values
![]() Legend Editor > Classification
Legend Editor > Classification
Concepts
It is recommended to read first Dataset Legend : Classification.
Classification Setup
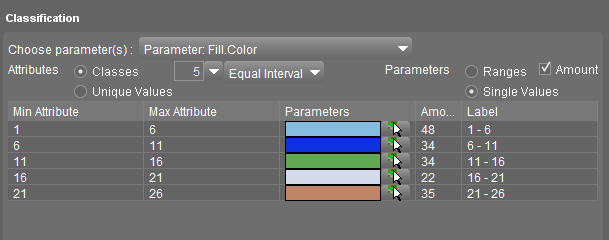
Classification using Classes
Classes or Range of values.
- Select a formula to calculate the range breaks, see below
- Define the number of classes.
- Orbit will auto-calculate the breaks for each value range using the attribute values of all objects and the chosen formula.
- If required adjust the value range of each class manually using the Min / Max attribute fields.
Formulas to auto-calculate the value ranges:
- Equal Interval
Each class will have the same length of range: (maximum attribute value - minimum attribute value) / number of classes. - Equal Amount
Each class will have (approximately) the same number of objects: (total number of objects) / number of classes.
One can still add or remove the classes manually, see below. - Natural
Classes will be calculated to obtain a normal (Gauss-Krüger) distribution of objects (and values): more information, Wikipedia, Normal Distribution.
Parameters:
- Single Values or Ranges: See below.
- Amount: Check the number of objects in each class.
Notes:
- From To: A range starts with and includes the minimum value. The range stops at and does not include the maximum value
- Redefining the number of classes will auto-calculate the ranges again. If you would like to add a class use the control buttons, see below.
- Do not use String-attributes to define classes. The division into classes is not reliable with String-values.
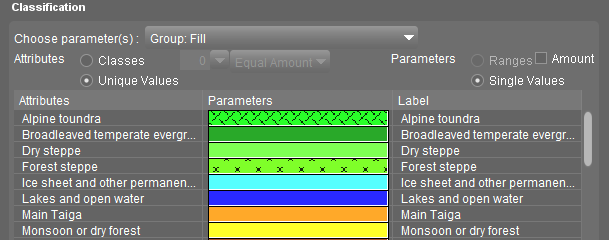
Classification using Unique Values
Notes:
- All existing values will be listed
When choosing for unique values Orbit will list alphabetic every unique value of the selected attribute.
You may wish to prepare a legend to represent future objects as well, which may have other values than present. Simply add a class and enter the value, see below. - Manageable amount of values
Listing all unique values may lead to hundreds of records. It is advised to keep the amount of classification values limited. The use of classes may be helpful to do so.
Add, Remove and Order Classes

- Add a new class.
- Delete the selected class.
- Move the selected class one up in the legend display.
- Move the selected class one down in the legend display.
Classification Appearance
Changing the presentation of the selected Graphical parameter(s).
Set appearance by Single Values or Ranges
Single Values
Each class/value has one graphical representation.
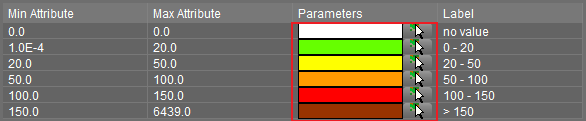
Ranges
Only when using classes it is possible to define a from - to graphical representation. The Min and Max presentation for each class (range) can be set.
Any attribute value in between will be interpolated.

Edit graphical appearance of Classes
Double click and edit
Double click the graphical presentation (field “Parameters”) to edit the selected graphical parameter(s), for example:
- Fill.Color: The edit fields present a color chooser.
- Group Line: Only for all the outline graphic parameters can be modified.
- All Parameters : All graphical parameters can be modified. The list of available parameters depends the spatial type of the dataset model.
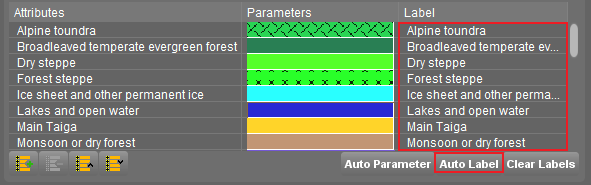
Auto Parameter
Use the Auto Parameter function to apply well-defined palette or pattern on the selected graphical parameter.
This functions is available for:
- Outline Color
- Fill Color
- Line Width
- Symbol Size
- Symbol Name
For more information, see Auto Parameter
Edit Labels of Classes
For display purposes you may want to assign a label to each class or value. Legend Displays are used in the Legend Display and can be used on a printout via the Print Layout.
Just click the label field (right of the graphical presentation) and enter a label text.
Auto Label
Use of Auto Label:
- No value list is defined: Auto Label will copy the attribute value to the legend label field.
- A value list is defined: Auto Label will copy the value list label to the legend label field.
Note:
- If the value list is defined and the value list label is empty, an empty entry will be copied to the legend label field.
Examples and Steps to create
It is advised to define first the Basic Appearance before classification.
- Define the Basic Appearance.
- Start Classification
- Select an attribute
- Select the type of classification (unique values, classes, direct link), see below
- Select one parameter or a group of graphical parameters that will be affected by the chosen attribute, see below
- If type of classification is classes or unique values
- Define different classes or unique values to classify
- Define the presentation of the selected graphical parameter(s) for each class or value

Example: World Population Density