For documentation on the current version, please check Knowledge Base.

Great Topics about Legend and Labeling
Page Index
Spatial Component vs Attribute Component
Legend vs modeltype

Depending on the modeltype of the dataset, other parameters will appear:
- Parameters of the Basic Appearance
- Parameters used for a Classification
| Vector Data | ||
|---|---|---|
| Points | Lines | Areas |
| → Add Labels and Pie Charts! | ||
| - Represent point objects by Symbols → Use Classification! | - Add Colors, Width and Line Style to line objects - Add a Symbol repetition to line objects → Use Classification! | - Adjust the outline: Add Colors, Width and Line Style - Adjust the outline: Add a Symbol repetition - Adjust the fill area: Add fill Colors, Gradient, Texture or Hatchlines → Use Classification! |
| Image & Raster Data | ||
| Images Standard | Black and White Images | Raster |
| - Use a transparent color - Adjust the image colors: brightness, contrast, saturation | - Use a transparent color - Adjust the background and foreground color separately | - Use a transparent color - Add colors to missing samples and background samples → Use Classification! |
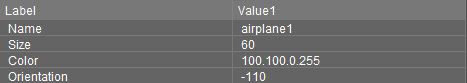
Display attribute values on the mapcanvas
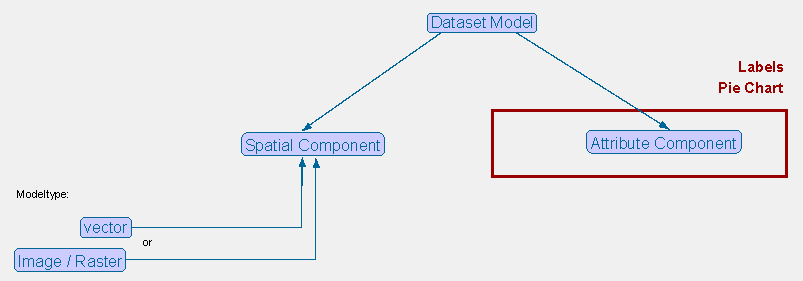
The attributevalues can be visualised on the map canvas as Labels or represented in Pie Charts.
Important: Only vector-formats can contain an attribute component!
Classification vs Basic appearance
This is an example when more classifications are used. Depending of the content of the attribute the appearance of the object will change.

This is how the legend is build:
| Basic Appearance |  |
|---|---|
| Classification I | 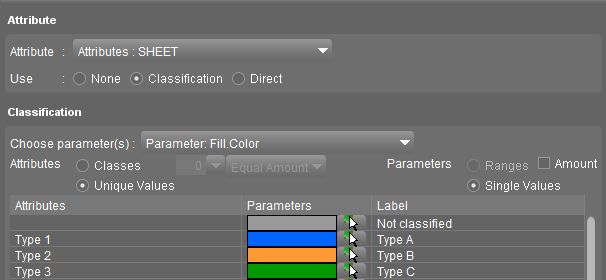 |
| Classification II | 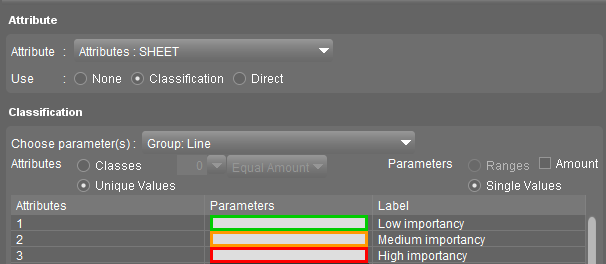 |
| Classification III | 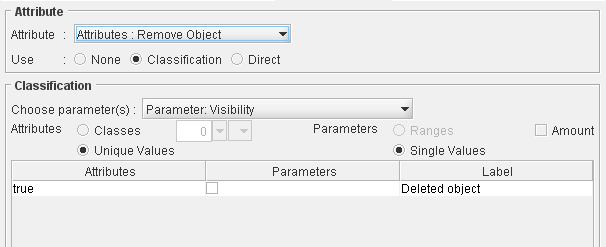 |
| Tips: - Add a class in the first classification that is the same as the Basic Appearance, with empty values. This way it is possible to create a label for non-classified objects. For example choose 'Not Classified' as label. - In the other classifications: remove the classes that are equal to the basic appearance (f.e. remove object: the class with value 'false' and visibility 'true' is not part of the legend - Only use parameters that are able to combine with eachother and not interact. |
|
| Examples | ||
|---|---|---|
 |  | Not classified |
 |  | Type B |
 |  | Not classified Low Importancy |
 |  | Type A High Importancy |
 |  | Type C Medium Importancy Deleted Object |
| Classification vs Basic Appearance: - In the first example, everything is based on the basic appearance. - In the second example the fill color is based on the classification, the outline on the basic appearance - In the third example the outline is based on the classification, and the fill color on the basic appearance. - In the fourth example outline and fill color are based on the classification. - In the fifth example outline and fill color are based on the classification, but are overruled by the classification of the visibility. |
||
More information about Classifications, see Dataset Legend : Classification
Classification Direct link
| Example | |
|---|---|
 |  |
All information see: Classification via Direct Link
Manage your own symbol-libraries
Use more symbols by adding your own symbol libraries to Orbit GIS!
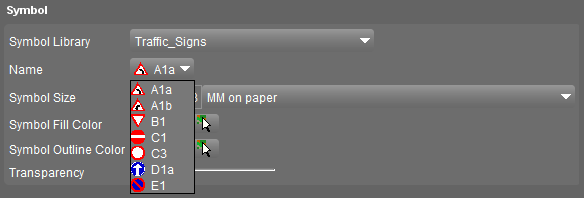
More information about Symbol Libraries, see Orbit Symbol Library
Legend vs Joined Table
In the legend, attribute values are used for classifications, labels and pie charts. Those attributes are not always attributes from the dataset itself, but can also be derived from attributes of a linked table!
- The attribute values are not stored in the dataset itself, but in an external table.
- An easy way to add more information to a dataset.
shapefile
A Shapefile can only contain one attribute set and one attribute value for each attribute in the dataset itself. By joining an external table to the dataset, a new attribute set and value(s) are added to the dataset, however, it is not stored in the dataset itself!
| Attribute values from the dataset |  |
|---|---|
| Attribute values derived from a Linked Table | 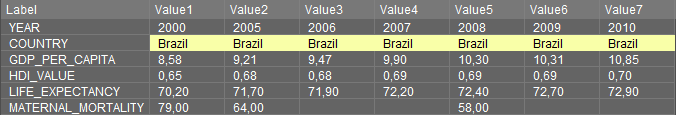 |
| → this way it is possible to make a Pie Chart by Classes to shapefiles, by using the attribute values from the Linked Table! |
|
More information about Table join, see Joins