For documentation on the current version, please check Knowledge Base.
Profiles and Cross Sections
This page describes how to use the extension “Profiles and Cross Sections” in the Orbit desktop.
The “Profiles and Cross Sections” extension makes it possible to create profiles and cross sections along a path on a point cloud dataset.
It is available for : Orbit MM Asset Inventory, Orbit MM Content Manager
![]() Main Toolbar > Extensions > Profiles & Cross Sections
Main Toolbar > Extensions > Profiles & Cross Sections
Concepts
Profiles
A path represents a line through the point cloud between two or more points, which gives as result the 3D representation of the point cloud along that line.
A profile represents a straight line through the point cloud between two points, which gives as result the 3D representation of the point cloud along that line.
Cross Sections
A cross section represents a perpendicular line on a path, which gives as result the 3D representation of the point cloud along that section.
A path can have along it multiple cross sections.
Files & folders
All created files and folders are saved in a new folder <name-of-opc-file>.profiles next to the Orbit Point Cloud file.
Sidebar
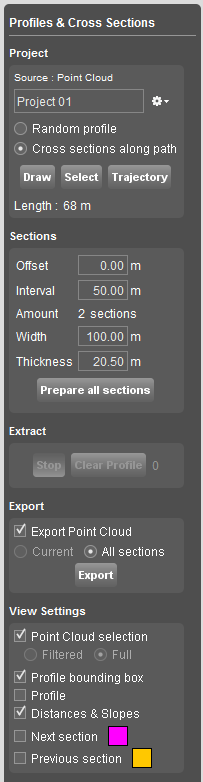
Project
Source
Displays the active dataset if it concerns an Orbit Point Cloud on which the Profiles and Cross Sections will be calculated.
File menu drop-down
Choose where you want to store profiles and cross sections. A project represents an automatically created destination folder for a profile and it's cross sections inside your runs pointcloud folder.
For each profile a new project will be created. Writing a new profile in an existing project will overwrite existing data in that folder.
Options to create a new project, open a recent project, close or delete a project are available.
Random profile
- Draw: Draw a new profile by clicking 2 positions (the beginning and the end of the path) on the Map Canvas. The profile will be calculated immediately after the second click. It is advised to draw the profile on Map 3D, due to the impossibility of controlling the Z value of your Path if you draw it on Map 2D.
- Select: Select a polyline object from the active dataset in the dataset list. The first segment of the selected object will be used to calculate the profile immediately.
- Trajectory: To use the trajectory, the vector file must be present in the dataset list.Only available for Orbit Mobile Mapping desktop software.
Cross sections along path
- Draw: Draw a new path by clicking the defining two or more positions.It is advised to draw the path on Map 3D, due to the impossibility of controlling the Z value of your Path if you draw it on Map 2D.
- Select: Select a polyline object from the active dataset in the dataset list. The enitre selected opbject will be used to calculate the cross sections path.
- Trajectory: To use the trajectory, the vector file must be present in the dataset list. Click and drag on Map Canvas to select the portion of the trajectory you want to use.
Length
Displays the length of the profile path.
The drawn profile and it's eventual cross sections based on the Sections parameters will appear on the Map Canvas.
Sections
Fill in the parameters for the creation of the cross sections:
Offset
Distance from the beginning of the path where the first cross section will be created.
Interval
The interval between cross sections in metres
Amount
Based on the interval and offset the amount of cross sections is automatically calculated.
Width
Set the width for all cross sections.
Thickness
Set the thickness for all cross sections.
To adjust the thickness for a random profile, fill in a value en apply (ENTER).
Prepare all sections
All new sections will be calculated. This will require some calculation time.
All sections will be available afterwords for fast displaying.
Profile
Draw
Allows you to draw and extract vertices on a random profile or on a cross section on the Profile Viewer Tab.
The vector dataset is stored in the folders “random_profile” or “along_path” (depending on the source profile).
Every segment of the digitized profile is accompanied by information : slope, difference in height and difference in xy.
Export
Export
Allows you the export the point cloud, the path, profiles and cross sections.
The results will be stored in a *.zip archive.
View Settings
Allows the user to control the amount of information:
- Show/hide point cloud selection on the Profile Viewer
- Show/hide the profile bounding box on the map
- Show/hide the drawn profile
- Show/hide distances and slopes on the Profile Viewer
- Colorize next and previous section on the map
Profile Viewer Tab
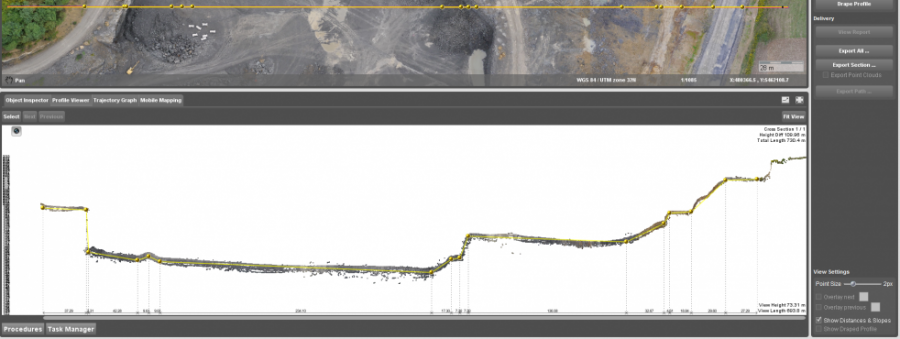
The Profile Viewer Tab allows the use to view the created paths, cross sections and their corresponding profiles.
By default, when creating a random profile, it will be displayed in the Viewer.
Open section
Navigation between cross sections is done using Open Section tool and by using the Next and Previous.
Information about the length of the path, the height difference, minimum and maximum height are shown.
The information about the drawn profile is also listed.
Pay attention
If the random profile or the sections are not displayed in the Profile Viewer Tab (blank screen), it's due to the outdated pointcloud legend file in the template used to create the run. To solve this issue, simply go to the pointcloud folder of your run and delete the “point_cloud.olg” file. Then go in the dateset list, right click on your pointcloud dataset and chose Legend Editor. By modifying the legend, a new legend will be automatically created. Re open the run and the profiles will be displayed. This new legend file can be copied to all old runs in order to avoid the same issue.