For documentation on the current version, please check Knowledge Base.
Clash Detection
This page describes the Orbit desktop extension “Clash Detection”.
![]() Main Toolbar > Extensions > Clash Detection
Main Toolbar > Extensions > Clash Detection
Concepts
The extension makes it possible to analyze a point cloud dataset for point cloud clashes within the volume defined by a 3D path and a 2D shape referenced to and perpendicular on this path.
Point cloud dataset
Only the active point cloud dataset will be used. If needed, priory merge multiple point cloud resources, see : Optimize Data.
3D Path
The 3D path can be defined by selecting a 3D poly-line, an ad hoc measurement or by defining a segment of a mobile mapping run trajectory.
2D Shape
The 2D shape can be created or imported from an Orbit Vector File and will be referenced, positioned, to the 3D path.
Files & folders
All created files and folders are saved in a new folder <name-of-opc-file>.clashdetection next to the Orbit Point Cloud file.
For each detection a new project folder will be created, see bellow “File menu drop-down”. Each project folder contains subfolders for each type of hit and the path used for the clash detection, see bellow “Analyze”. Each subfolder contains a vector file with the clusters detected (<type-of-hit_objects>.ovf ) and separate files for each cluster containing all identified lidar points ( <cluster-number_points>.ovf ).
Sidebar
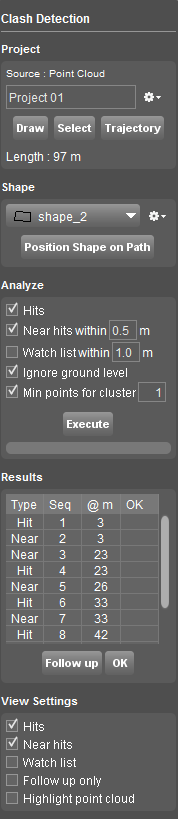
Project
Source
Displays the active dataset if it concerns an Orbit Point Cloud on which the clash detection will be calculated.
File menu drop-down
Choose where you want to store the Clash Detection results. A project represents an automatically created destination folder inside your runs pointcloud folder.
For each Clash Detection a new project will be created. Writing new data in an existing project will overwrite existing data in that folder.
Options to create a new project, open a recent project, close or delete a project are available.
3D Path
There are several possibilities to define the 3D Path:
- Draw - draw a new path , by clicking on the Map Canvas. By pressing Draw again after a Path is finished, the vertexes of the Path can be edited.
- Stop - finish the drawing of the path
- Select - select an existing vector as your path
- Trajectory - choose the run's trajectory as the path
The length of the path will be displayed.
It is advised to draw a new path on Map 3D, due to the impossibility of controlling the Z value of your Path if you draw it on Map 2D.
Shape
Source
Displays the 2D Shape in use for the detection. From the list of available shapes one can be chosen.
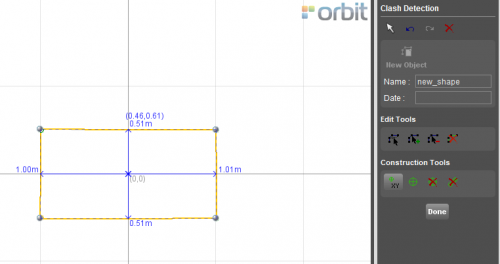
File menu drop-down
A list already created shapes can be used, or options to create a new one, import it, edit or delete an existing shape are available. The predefined shapes can't be edited, and their Position on Path can't be changed.
- New - create a new shape. Opens a window to define a new shape. The central coordinates represent the coordinates of the 3D Path. Create the new 2D Shape by pressing “New Object” and draw. Construction tools can help drawing accuracy. By pressing “Done”, the shape is created, displayed on the map around the 3D Path, and as the active shape.
- Import - imports allready created 2D Shapes in a .ovf file
- Duplicate- duplicates the active shape
- Edit - reopens the 2D Shape window for editing
- Delete- deletes the selected shape
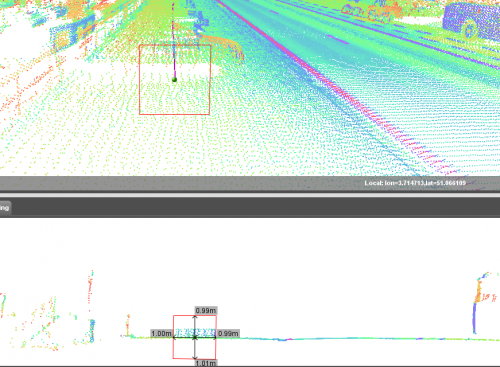
Position Shape on Path
Opens the “Clash Detection” tab, and gives the possibility to adjust the position of the 2D Shape in report with the 3D Path. By default the shape will be centered around the path, by dragging it can be re positioned.
Analyze
Define parameters for the detection by enabling them or not and execute the search.
- Hits - the tool will detect all points that are found inside the 2D Shape's pass along the 3D Shape.
- Near hits - the tool will detect all points that are in a defined range around the 2D Shape's pass along long the 3D Path. The distance can be customized
- Watch list - the tool will detect all points that are in a defined range around the 2D Shape's pass along long the 3D Path. The set distance can be greater then the “Near Hits”
- Ignore ground level - the points corresponding to the ground level will not be considered
- Min points for cluster - the minimum number of points necessary for a hit to be counted as such
By pressing execute the detection will commence.

Results
The table will display the results of the Clash Detection.
- Type - type of clash: Hit, Near Hit, Watch List
- Seq - detected cluster number in sequence from the start of the Path
- @m - distance in meters from the start of the Path
- OK - flag on for checked points
- Follow up- view in sequence all results
By double-clicking on any of the results, the Map Canvas and the 3D pointcloud view will focus on the location of the detected points.
Pay attention, if you have created in the same session an .opd file ( See ), that is still present in the Pointcloud folder, the Clash detection procedure will not be able to complete results.
View Settings
Tools to customize the visualization.
By enabling them it is possible to view or not the Hits, Near Hits, the Watch List or for example to highlight the detected pointcloud points.